Analyzing deadlocks using telemetry or application insights can be done via KQL language. KQL, or Kusto Query Language, is a powerful query language that you can use to search and analyze data within Microsoft Azure. In the context of Business Central, KQL can often be used to gain deep insights from large amounts of data. This data is also referred to as telemetry.
You can use KQL within Azure Data Explorer, among other tools, or you can use KQL within Kusto Explorer. You can use the template below.
// Customer Name: Contoso
let _startTime = datetime(2025-04-08T07:00:00Z);
let _endTime = datetime(2025-04-08T10:59:00Z);
let _aadTenantId = "";
let _environmentName = "Production";
let _environmentType = "Production";
let _companyName = "CRONUS Nederland BV";
traces
| where timestamp between (_startTime.._endTime)
| where customDimensions.aadTenantId == _aadTenantId
| where customDimensions.environmentType == _environmentType
| where customDimensions.environmentName == _environmentName
| where customDimensions.companyName == _companyName
| where severityLevel == 3
| project
timestamp,
message,
alDetailedErrorMessage = customDimensions.alDetailedErrorMessage,
severityLevel,
eventId = customDimensions.eventId,
alObjectId = customDimensions.alObjectId,
alStackTrace = customDimensions.alStackTrace,
extension = customDimensions.extensionPublisher,
customDimensions
| limit 1000
Analyzing deadlocks Business Central using telemetry
You can find samples on GitHub. Another example in combination with the template above is provided below.
// Customer Name: Contoso
let _startTime = datetime(2025-04-08T07:00:00Z);
let _endTime = datetime(2025-04-08T10:59:00Z);
let _aadTenantId = "";
let _environmentName = "Production";
let _environmentType = "Production";
let _companyName = "CRONUS Nederland BV";
traces
| where timestamp between (_startTime.._endTime)
| where customDimensions.aadTenantId == _aadTenantId
| where customDimensions.environmentType == _environmentType
| where customDimensions.environmentName == _environmentName
| where customDimensions.companyName == _companyName
| where customDimensions.eventId == 'RT0028'
| where customDimensions.alObjectId > 0 // filter out internal server calls
| extend eventId = customDimensions.eventId
, aadTenantId = customDimensions.aadTenantId
, environmentName = customDimensions.environmentName
, environmentType = customDimensions.environmentType
, companyName = customDimensions.companyName
, extensionId = customDimensions.extensionId
, extensionPublisher = customDimensions.extensionPublisher
, extensionName = customDimensions.extensionName
, extensionVersion = customDimensions.extensionVersion
, sessionId = customDimensions.sessionId
, alObjectId = customDimensions.alObjectId
, alObjectName = customDimensions.alObjectName
, alObjectType = customDimensions.alObjectType
, alStackTrace = customDimensions.alStackTrace
, clientType = customDimensions.clientType
, sqlStatement = tostring(customDimensions.sqlStatement)
, sqlServerSessionId = customDimensions.sqlServerSessionId
| extend operationType = case(
  sqlStatement startswith "UPDATE", "UPDATE"
, sqlStatement startswith "DELETE", "DELETE"
, sqlStatement startswith "BeginTransaction", "BEGIN_TRANS"
, sqlStatement matches regex "INSERT INTO", "INSERT"
, sqlStatement startswith "SELECT", "SELECT"
, sqlStatement matches regex "IF EXISTS \\(SELECT (.*)\\) SELECT", "SELECT'"
, sqlStatement has "SELECT NEXT VALUE FOR", "SELECT_SEQUENCE_VALUE"
, sqlStatement has "SELECT @@SPID", "SELECT_SPID"
, sqlStatement matches regex "(.*)WITH", "SELECT"
, sqlStatement startswith "CREATE TABLE", "CREATE_TABLE"
, sqlStatement startswith "ALTER TABLE", "ALTER_TABLE"
, sqlStatement startswith "exec sp_rename", "RENAME_TABLE"
, sqlStatement matches regex "(.*)DROP TABLE", "DROP_TABLE"
, sqlStatement startswith "SET LOCK_TIMEOUT", "SET_LOCK_TIMEOUT"
, sqlStatement has "sp_getapplock", "GET_APP_LOCK"
, "UNKNOWN"
)
, usertelemetryId = case(
  // user telemetry id was introduced in the platform in version 20.0
  toint( substring(customDimensions.componentVersion,0,2)) >= 20, user_Id
, 'N/A'
)
The user _Id is the same as the Telemetry Id found on the user card within Business Central. This means you can easily analyze deadlocks using telemetry from Application Insights. Of course, on GitHub, you’ll find many more examples and a cheat sheet.
The deadlock telemetry of the database collects information about deadlocks that occur. Deadlocks can prevent users from completing tasks in the Business Central client. A deadlock occurs when two or more processes block each other because each has locked a database resource. The system terminates and rolls back one of the sessions (known as the deadlock victim) and then sends out a telemetry signal.
As a partner or developer, this telemetry offers several benefits:
- Database lock trace telemetry. For more information, see Database lock trace telemetry.
- Makes you aware of the fact that deadlocks are occurring.
- Allows you to identify who the victim was in deadlock situations.
- In some deadlock issues, the process that is the victim and the process that succeeds will change randomly. In these cases, both are stored in the telemetry source as separate deadlock events.
- For further monitoring and troubleshooting, this telemetry is supplemented with other features such as:
- Database lock trace telemetry. For more information, see Database lock trace telemetry.
- Enabling SQL database deadlock monitoring in a sandbox or on-premises environment. For more information, see Monitoring SQL Database Deadlocks.
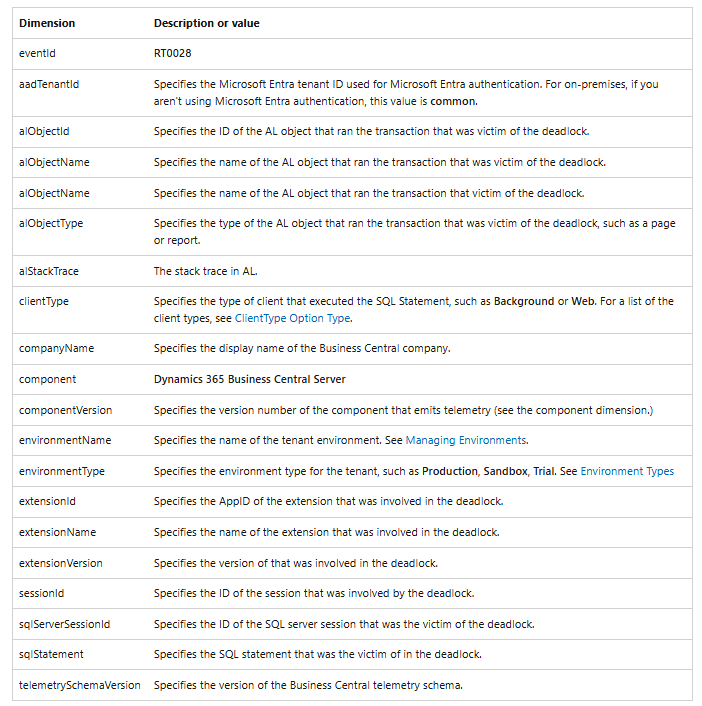
Custom dimensions within the telemetry explained in more detail
inally, more information about Microsoft Business Central can be found here. To return back to the main page, you can click here.