How do you configure alerts within Application Insights? (Complete Guide)
When you’re running applications in Azure, it’s crucial to quickly know when something goes wrong. One of the most effective ways to achieve this is by configuring alerts within Application Insights that trigger as soon as an exception occurs.
In this blog, I’ll explain step by step how to configure such an alert, even when you’re working with a demo environment where (almost) no real exceptions occur.
Why Set Up Exception Alerts in Application Insights?
Application Insights automatically collects telemetry such as:
- Exceptions
- Requests
- Dependencies
- Logs
- Performance metrics
By setting an alert that triggers when an exception occurs, you get an immediate notification via email, Teams, webhook, or another notification channel. This helps you respond to issues more quickly and monitor proactively.
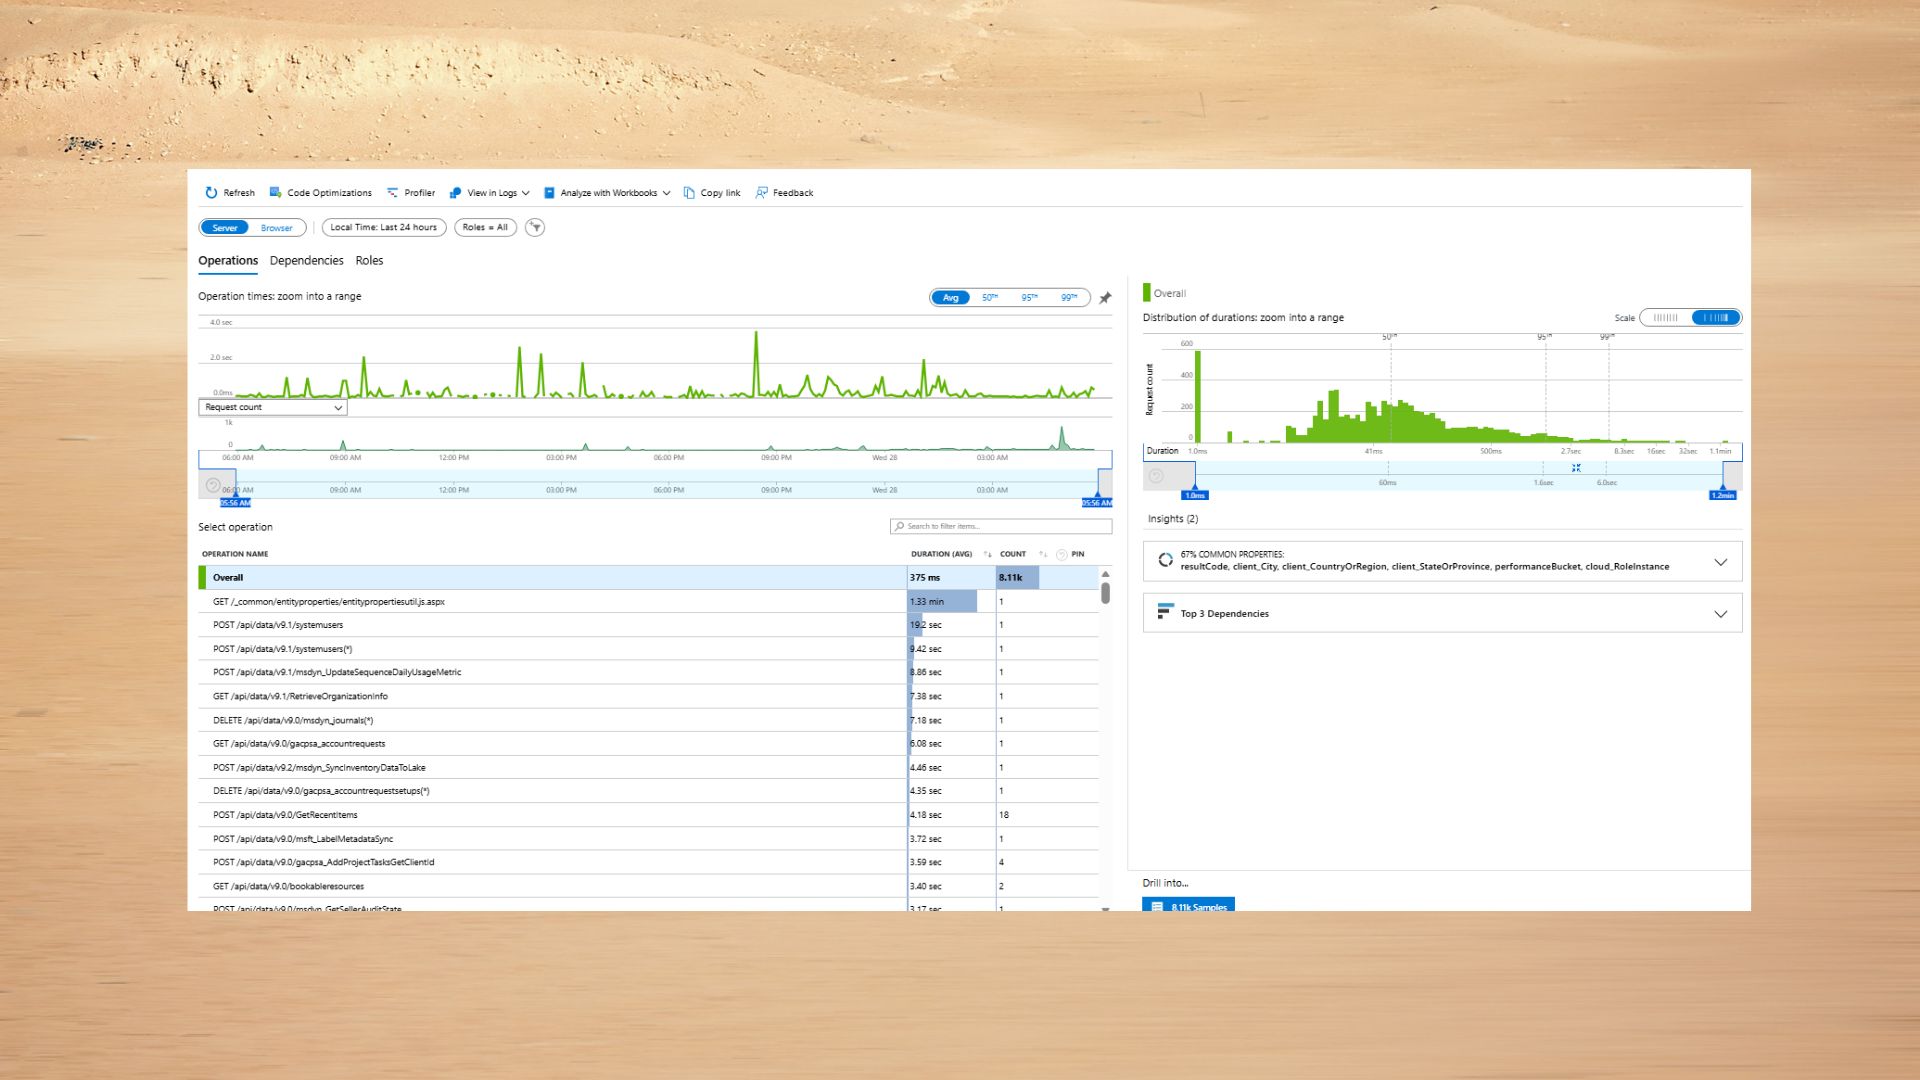
Step 1 – Open Your Application Insights Resource
- Log in to the Azure Portal
- Search for Application Insights
- Select the resource for your application
This is the base where all your telemetry is collected.
Step 2 – Go to “Alerts”
In the left-hand menu of Application Insights:
➡️ Monitoring → Alerts
You’ll now land in the central alert overview of Azure Monitor.
Then click:
➡️ Create → Alert rule
Step 3 – Choose the Correct Resource (Scope)
You’ll now see the Scope section. Normally, your Application Insights resource is already selected here.
If not:
- Click Select resource
- Choose Application Insights
- Select your AI instance
- Click Apply to continue.
Step 4 – Select the Correct Signal (Condition)
Under Condition, choose which data point should trigger the alert.
Click:
➡️ Add condition
Now you can choose between two types of signals:
✔ Option 1: Built‑in signal “Exceptions”
Azure has a standard signal called Exceptions. This simply counts the number of exceptions Application Insights has recorded.
This is the fastest and most commonly used method.
✔ Option 2: Custom log search (KQL)
If you want to filter more specifically, for example by severity or type, you can use a KQL query:
exceptions
| where severityLevel >= 3
| summarize count() by bin(timestamp, 5m)
Useful for apps with a lot of noise or non‑critical errors. Optionally, you can test this first with View result and edit query in Logs. If you’ve done that and the output is what you expect, you can click Continue Editing Alert.
Step 5 – Define the Alert Logic
Once you’ve selected the exceptions signal, you need to configure the logic.
Frequently used settings are:
- Measure: Count
- Aggregation type: Total
- Aggregation granularity: 5 minutes
- Operator: Greater than
- Threshold: 0
- Frequency of evaluation: 5 minutes
This means:
If at least one exception has occurred in the past 5 minutes, the alert will fire.
Perfect for production and demo environments. Click Next: Actions.
Step 6 – Choose an Action Group (Notifications)
Now it’s time to configure who receives the alert.
Click:
➡️ Create action group
Besides the fields already filled in, you must provide an Action group name and Display name.
Click Next: Notifications to move on.
Common notification options:
📧 E-mail Azure Resource Manager Role
💬 Email/SMS Message/Push/Voice
For demos, a simple email or Teams notification is usually sufficient.
Within Email/SMS Message/Push/Voice, select Email and enter the recipient’s email address. Ideally, use a group here. For demo purposes, you can use your own email address.
Finally, you need to provide a Name. This must be unique and under 128 characters. Notifications and Actions must be unique from each other.
Click Next: Actions to continue. This step is optional.
Click Review + Create to continue. After reviewing the settings, click Create.
Step 8 – Name the Alert Rule and Save to Activate Alerts in Application Insights
You can provide an Email subject here. For example:
Application Insights – Exception Alert
Click Next: Details and fill in the required fields, leaving everything else as is. Finally:
➡️ Review + Create
Your alert is now active!
How Do You Test This Alert Without Real Exceptions?
In demo environments, it’s common to have no exceptions at all. Fortunately, there are three ways to still test this.
For testing, you can use a KQL query that always returns results:
union (exceptions), (datatable(dummy:string) ["test"])
| summarize count()
The result will then look like this.
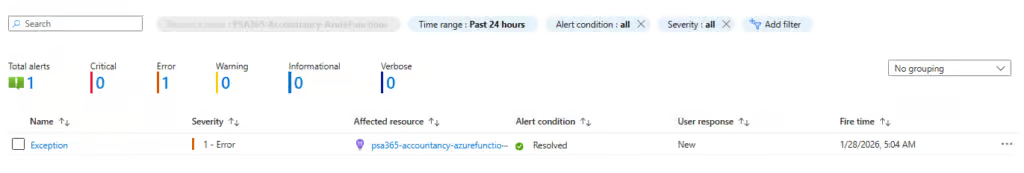
Alerts in Application Insights
An example of an email that is sent looks like this.
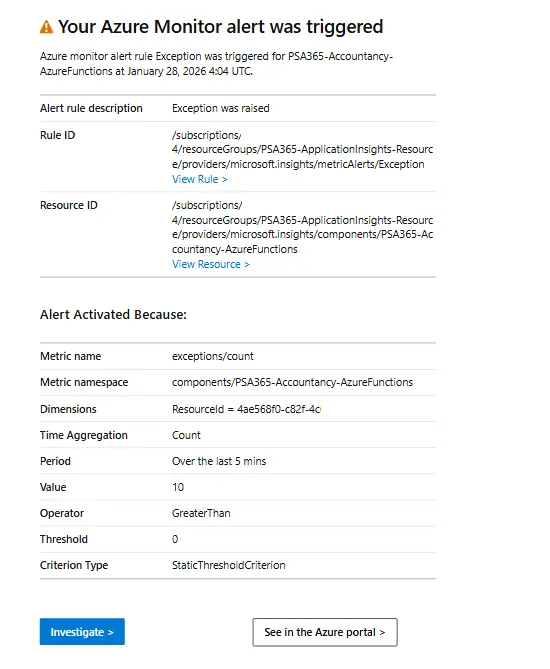
Alerts in Application Insights
Conclusion
In summary, setting up an alert on exceptions in Application Insights is one of the simplest and most powerful ways to monitor the health of your application. With just a few steps, you have a complete monitoring flow, including automatic notifications via email, Teams, or other channels.
Even if you have a demo environment with few errors, you can easily test this using code, Postman, or a dummy query.
For more information about Monitor alerts, click here. If you have any questions about this blog post, contact me via the contact form.