A practical guide for system administrators
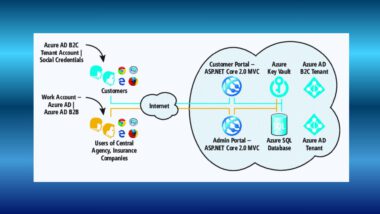
Telemetry has therefore become indispensable for organizations that want to maintain full control over the performance, stability, security, and usage of their business applications. In modern cloud environments, proactive monitoring plays a crucial role in preventing disruptions and optimizing the user experience. For Microsoft Dynamics 365 Customer Engagement (CE), Azure Application Insights provides a powerful and scalable solution to collect in‑depth telemetry data, performance measurements, error analyses, and user interactions.
With the help of Azure Monitor, Log Analytics, and Application Insights, you gain insight into API calls, plug‑in performance, Dataverse queries, latency, error codes, and other critical signals that are essential for professional system administration. This blog therefore takes you step by step through the entire process: from creating a new Application Insights resource in Azure, to configuring Data Export in the Power Platform Admin Center, and setting up a secure security group with read‑only access to all log and telemetry information.
This approach ensures that, as a system administrator, you have a robust, secure, and future‑proof monitoring architecture that meets best practices for cloud governance, compliance, observability, and operational management within Dynamics 365 Customer Engagement.
Why connect Application Insights and CE?
Customer Engagement generates a huge amount of operational data. Think of API calls, plug‑in performance, error messages, and user interactions. By exporting this data to Application Insights, you can:
- Detect problems faster
- Analyze trends
- Identify performance bottlenecks
- Make better fact‑based decisions
For system administrators, this is an opportunity to manage proactively instead of reactively putting out fires.
Step 1: Create a new Resource Group in Azure for Application Insights and CE
Good structure starts with clean resource organization. This is how you create a new Resource Group:
Instructions
- Go to the Azure Portal: https://portal.azure.com
- Search for Resource groups in the top left.
- Click Create.
- Enter the following details:
- Subscription: choose the correct subscription
- Resource group name: for example rg-ce-telemetry-prod
- Region: choose the same region as your CE environment (e.g., West Europe)
- Click Review + Create and then Create.
Step 2: Create an Application Insights resource and link it to CE
Now that the Resource Group is ready, you can add Application Insights.
Instructions
- Go to Create a resource in the Azure Portal.
- Search for Application Insights.
- Click Create.
- Enter the configuration:
- Subscription: same as the Resource Group
- Resource Group: select the newly created group
- Name: for example appi-ce-telemetry-prod
- Region: choose the same region as CE
- Workspace Details: filled in automatically
- Click Review + Create and then Create.
Step 3: Configure Data Export in the Power Platform Admin Center to link Application Insight and CE together
Customer Engagement can export telemetry via the Data Export functionality.
Instructions
- Go to the Power Platform Admin Center: https://admin.powerplatform.microsoft.com
- Navigate to Environments and select the correct CE environment.
- Go to Data → Data Export → App Insights.
- Choose New data export.
- Enter the following details:
- Name the export package: for example CE Telemetry Export
- Select Dataverse diagnostics and performance
- Select all components (Dataverse dependencies, Dataverse Exceptions, Query Throttling, Inbound API requests, Outbound network requests, and Page Views)
- Click Next.
- Select the correct environment (typically the production environment).
- No existing export may already be configured for that environment — if so, it must be removed first
- The environment must be a Managed environment
- Click Next.
- Select the correct Subscription (typically the same as before).
- Select the correct Resource Group (typically the same as before).
- Select the newly created Application Insights instance (appi-ce-telemetry-prod).
- Click Next and finally Create.
From this moment on, Customer Engagement automatically starts sending telemetry data to Application Insights.
Step 4: Create a Security Group for read‑only access
You don’t want everyone to be able to change settings. A separate group with read‑only permissions is therefore essential.
Instructions
- Go to Azure Active Directory: https://portal.azure.com → Azure Active Directory.
- Click Groups → New group.
- Choose:
- Group type: Security
- Group name: sg-appi-ce-readers
- Description: “Read‑only access to CE Application Insights telemetry”
- Create the group and immediately add an Owner.
- Open the group and add users who should have read‑only access.
Assigning access in Application Insights
- Go to Azure Active Directory: https://portal.azure.com → Azure Active Directory.
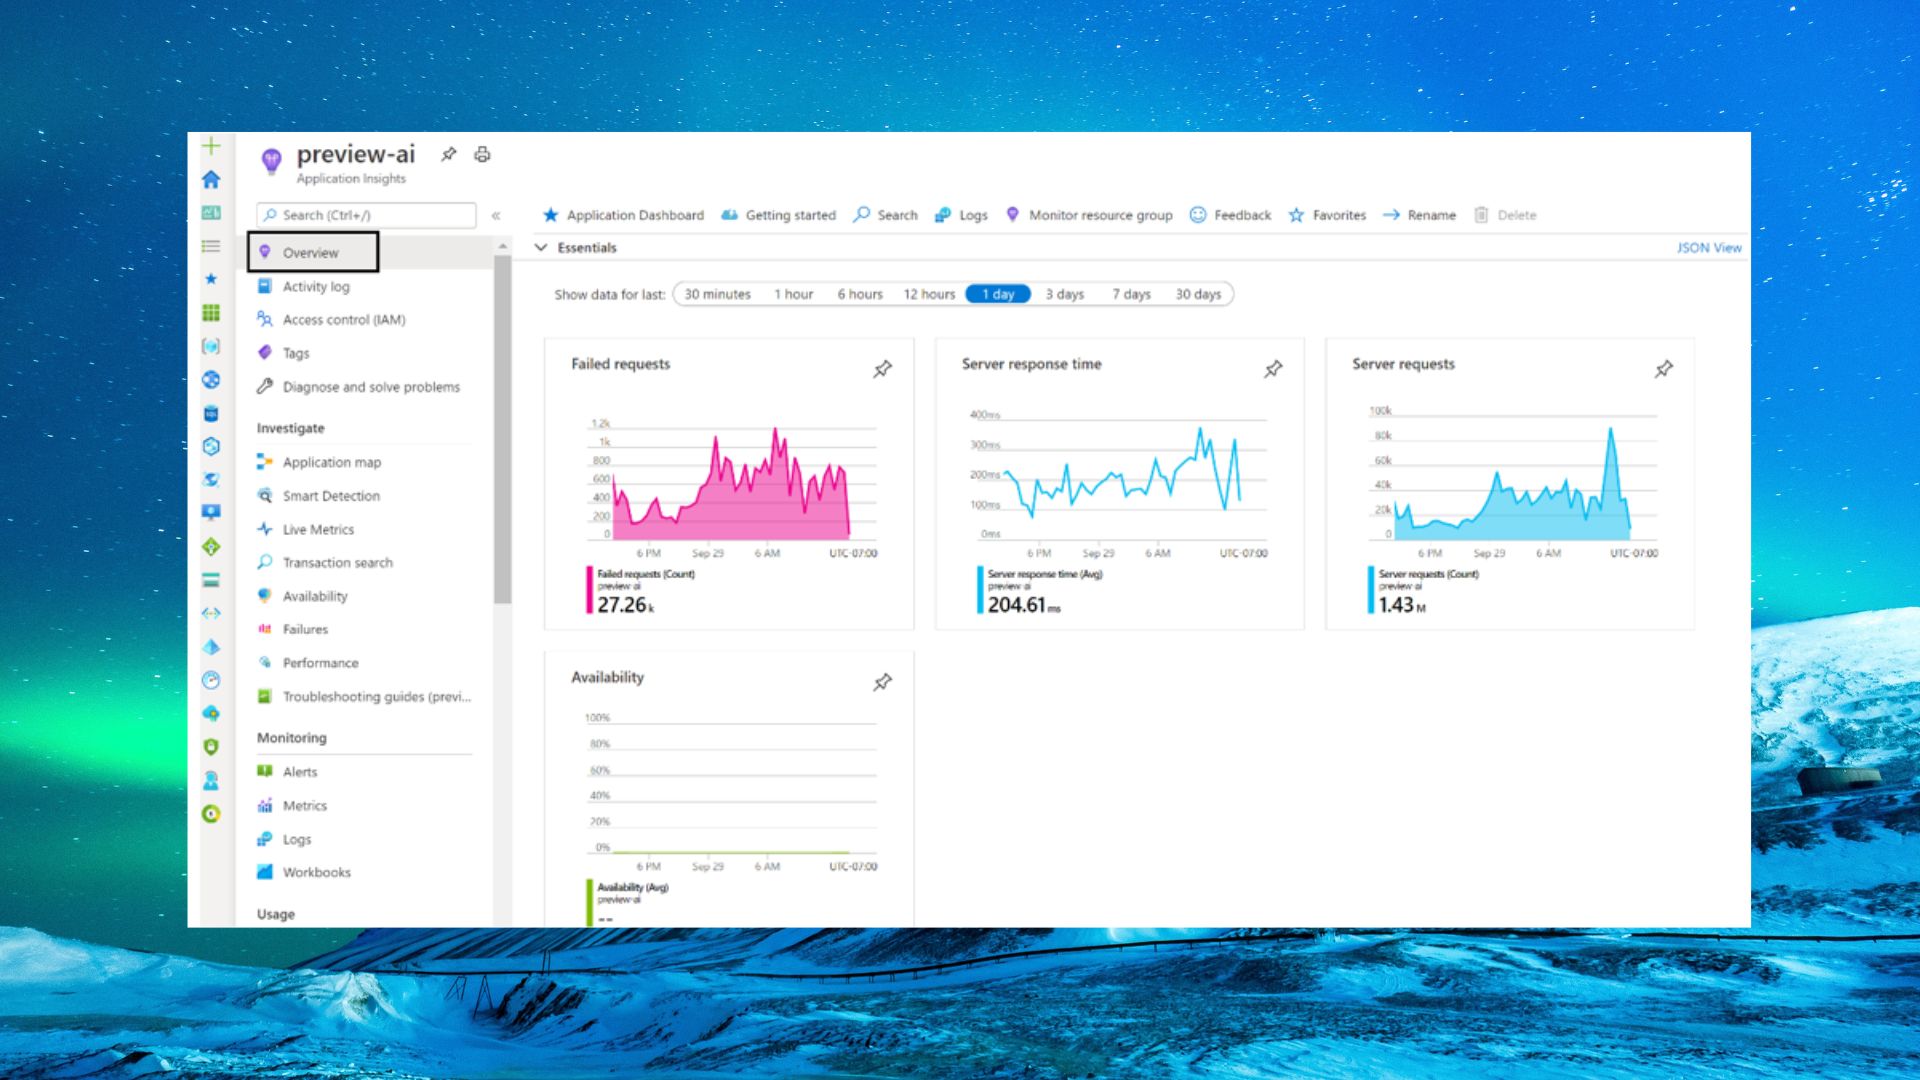
- Go to Application Insights.
- Open the Application Insights resource (appi-ce-telemetry-prod).
- Click Access control (IAM).
- Choose Add → Add role assignment.
- Select the role Monitoring Reader.
- Assign it to the group sg-appi-ce-readers.
- Click Members.
- Click Select Members.
- Click Review + assign twice.
Users in this group can now view all telemetry but cannot modify anything.
Conclusion
With these steps, you now have a fully configured telemetry solution for Customer Engagement:
- A structured Resource Group
- An Application Insights resource for deep monitoring
- A connected data export from CE
- A secure read‑only group for controlled access
This gives system administrators a solid foundation for proactive management and improving the quality of the CE environment.
If you want more information about Application Insights, click here. If you have questions about this blog post, contact me via the contact form.